How to use: For each topic: read the definition -> learn the pros/cons table -> memorize the short evaluation -> use the mind map for quick recall.
Table of Contents
- Chapter 1 - External Influences on Business Activity
- Chapter 2 - External Economic Influences
- Chapter 3 - Introduction to Business Strategy
- Chapter 4 - Strategic Analysis
- Chapter 5 - Strategic Choice
- Chapter 6 - Strategic Implementation
- Chapter 7 - Organisation Structure
- Chapter 8 - Business Communication
- Chapter 9 - Leadership
- Chapter 10 - Human Resource Management Strategy
- Chapter 11 - Marketing Analysis
- Chapter 12 - Marketing Planning and Strategy
- Chapter 13 - Globalization and International Marketing
- Chapter 14 - Location and Scale
- Chapter 15 - Quality Management
- Chapter 16 - Operations Strategy
- Chapter 17 - Operations Planning and Project Management
- Chapter 18 - Financial Statements
- Chapter 19 - Analysis of Published Accounts
- Chapter 20 - Investment Appraisal
- Chapter 21 - Finance and Accounting Strategy
- Paper 4 Formats - Question Types and Attempting Pattern
Exam Booster Pack (All Chapters)
Core formulas you must remember
- PED = % change in quantity demanded / % change in price.
- YED = % change in demand / % change in income.
- XED = % change in demand of Good A / % change in price of Good B.
- Promotional elasticity = % change in demand / % change in promotional spending.
- Labour productivity = total output / number of workers.
- Absenteeism % = employees absent / total employees x 100.
- Contribution per unit = selling price - variable cost per unit.
- Current ratio = current assets / current liabilities.
- Acid-test ratio = (current assets - inventories) / current liabilities.
- ROCE = net profit / capital employed x 100.
- Gross profit margin = gross profit / revenue x 100.
- Operating profit margin = operating profit / revenue x 100.
- Inventory turnover = cost of sales / average inventory.
- Trade receivables days = trade receivables / credit sales x 365.
- Trade payables days = trade payables / credit purchases x 365.
- Gearing = non-current liabilities / capital employed x 100.
- Dividend yield = dividend per share / share price x 100.
- Dividend cover = profit after tax / total ordinary dividends.
- P/E ratio = market price per share / earnings per share.
- Payback = time to recover initial investment.
- ARR = average annual profit / initial investment x 100.
- NPV = total discounted cash inflows - initial investment.
Named theorists/models to quote in answers
- Porter: competitive advantage and five forces.
- Ansoff: growth matrix and risk levels.
- Lewin: force-field analysis.
- Chandler: "structure follows strategy".
- Prahalad and Hamel: core competencies.
- Herzberg, Maslow, McGregor: motivation and management style links.
- French and Raven: power and influence bases.
- Goleman: emotional intelligence competencies.
- Charles Handy: shamrock organisation.
- Kaizen and TQM: continuous improvement culture.
High-scoring evaluation sentence starters
- "In the short run, this may reduce costs, but in the long run it can damage..."
- "The effectiveness depends on industry type, market conditions, and management capability."
- "A balanced approach is better than an extreme approach because..."
- "This strategy is suitable only when demand is predictable and resources are available."
- "Although the model gives useful guidance, decision-makers must also consider qualitative factors."
- "The final judgement should depend on business size, objectives, and risk appetite."
Flowchart Mind Map - Exam Answer Structure
Define -> Apply to case/business -> Analyse impact -> Evaluate conditions -> Final judgement
1) Protectionism, Free Trade & Globalisation
Protectionism: Government uses trade barriers to protect local businesses from foreign competition.
Tariff: Tax on imports, making foreign goods more expensive.
Quota: Limit on quantity/value of imports over a time period.
Voluntary Export Restraint (VER): Exporting country agrees to limit exports to another country.
Free Trade: Countries trade without barriers like tariffs/quotas.
Globalisation: Free movement of people, goods, capital and ideas across countries.
Comparative Advantage: A country should specialize in goods it can produce at lower opportunity cost.
| Approach | Advantages | Disadvantages |
|---|---|---|
| Protectionism | Protects infant/local industries, protects jobs, can reduce import dependence. | Higher prices, less consumer choice, lower pressure to innovate, possible trade wars. |
| Free Trade / Globalisation | More consumer choice, access to raw materials, greater competition, better quality, specialization, higher living standards. | Local firms can collapse, job losses in weak sectors, overdependence on foreign supply chains, inequality between winners and losers. |
Short evaluation: Free trade usually helps long-run efficiency and living standards, but weak local industries may need temporary protection. Best policy is selective protection plus competitiveness investment (skills, tech, R&D).
Mind Map - Trade & Globalisation
Protectionism
- Tariff
- Quota
- VER
Free Trade Drivers
- WTO
- Trading blocs
- Global integration
Benefits
- Choice
- Lower costs
- Comparative advantage
Risks
- Import pressure
- Job losses
- Dependency
2) Political & Legal Constraints
Privatisation & Nationalisation
Privatisation: State-owned business is sold to private sector investors.
Nationalisation: Government takes ownership of private business.
| Concept | Advantages | Disadvantages |
|---|---|---|
| Privatisation | Profit motive can increase efficiency; faster decisions; sale proceeds for government projects; performance incentives. | Risk of higher prices in essential services; redundancies; short-term profit focus; weaker accountability; private monopolies may still need regulation. |
| Nationalisation | Greater government control in strategic sectors; can prioritize public welfare and equal access. | Possible inefficiency, bureaucracy, political interference, and lower innovation incentives. |
Short evaluation: For strategic services (water, power, transport, health), pure profit motive can harm consumers. Hybrid models (private efficiency + strong regulation) often give better outcomes than extreme positions.
Employment Laws
Employment laws: Rules about hiring, contracts, discrimination, pay, dismissal, and health & safety to protect both workers and employers.
| Employment Law Impact | Advantages | Disadvantages |
|---|---|---|
| Contracts, recruitment, dismissal, safety | Fair treatment, motivated staff, lower injury risk, better reputation, attracts skilled workers, less legal risk when compliant. | Higher labour costs, compliance/admin costs, expensive safety equipment, overtime and flexibility limits, paid leave costs. |
Short evaluation: Employment laws raise short-run costs but improve long-run productivity and reduce legal/ethical risk. Businesses with good HR systems usually gain more than they lose.
Consumer Protection Laws
Consumer protection laws: Laws that stop businesses from misleading, unsafe, or unfair selling.
| Consumer Protection | Advantages | Disadvantages |
|---|---|---|
| Rules on product quality, safety, descriptions, fair selling | Safer products, reduced exploitation, more trust, better brand loyalty, fewer court cases if firms comply. | Redesign and reformulation costs, stricter marketing controls, higher compliance burden. |
Short evaluation: Strong consumer law can increase costs, but trust and loyalty often create long-term gains. Ethical treatment of consumers is now a competitive advantage, not only a legal duty.
Mind Map - Political & Legal Constraints
Ownership Policy
- Privatisation
- Nationalisation
- Regulation
Employment Law
- Contracts
- Equal opportunity
- Health & safety
- Termination rules
Consumer Law
- Product safety
- Honest information
- Fair selling
Business Effect
- Higher compliance cost
- Lower legal risk
- Better reputation
3) Competition, Monopoly & Restrictive Practices
Competition laws: Laws to keep markets fair and stop abuse of market power.
Monopoly: Single firm with dominant market share (often treated as 25%+ in course context).
Collusion: Firms secretly cooperate (not compete) to control prices/output/market.
Restrictive practices: Anti-competitive actions like price-fixing, market sharing, full-line forcing, refusal to supply, predatory pricing.
| Market Structure/Practice | Possible Advantages | Possible Disadvantages |
|---|---|---|
| Competition laws | Lower prices, better quality, innovation, more consumer choice. | Can reduce large merger efficiencies if over-restrictive. |
| Monopoly | Economies of scale may lower average costs; can fund R&D. | Higher prices, less choice, complacency, less efficiency pressure. |
| Restrictive practices (cartels, predatory pricing, forced supply terms) | Usually no public benefit in exam context. | Harms consumers and smaller firms; distorts fair market outcomes. |
Short evaluation: Market power is not always bad if scale lowers costs, but unchecked power usually hurts consumers. Strong regulators are needed to balance efficiency with fairness.
Mind Map - Competition & Monopoly
Competition Law Goals
- Fair prices
- Choice
- Innovation
Monopoly Creation
- Mergers/acquisitions
- Legal protection
- Unique products
Restrictive Practices
- Price fixing
- Market sharing
- Predatory pricing
- Full-line forcing
Regulator Role
- Monitor abuse
- Block harmful mergers
- Protect consumers
5) Environmental Constraints & Pressure Groups
Environmental constraints: Business limits caused by pollution laws, climate pressure, sustainability expectations, and resource scarcity.
Environmental audit: Assessment of pollution, energy use, wastage, transport use, and recycling performance.
Pressure group: Organization with a shared aim that influences business/government/consumers to change behavior.
| Concept | Advantages | Disadvantages |
|---|---|---|
| Going Green | Better image, stronger customer support, attracts skilled staff, avoids legal/public pressure, possible long-term savings. | High short-term investment, possible lower profits, weak legal enforcement in some countries reduces motivation. |
| Environmental Audit | Tracks performance, supports targets, free positive publicity if credible. | Costly and time-consuming, can be used as false PR if not genuine. |
| Pressure Groups (WWF, Greenpeace, Amnesty, Fairtrade) | Raise awareness, improve policy, push ethical standards, encourage better business practices. | Can create reputation shocks, protests or boycotts; firms may face sudden public pressure. |
Short evaluation: Environmental strategy is no longer optional for many firms. The strongest approach is to integrate sustainability into operations, not just marketing claims.
Mind Map - Environment & Pressure Groups
Environmental Problems
- Air/water/noise pollution
- Congestion
- Global warming
Business Response
- Go green
- Cleaner tech
- Energy shift
- Audit systems
Pressure Groups Influence
- Lobby governments
- Negotiate with firms
- Consumer campaigns
Outcomes
- Reputation gain/loss
- Policy change
- Sales impact
6) International Influences, MNCs & Trade Agreements
Multinational Company (MNC): Business with headquarters in one country and operations/branches in other countries.
International trade agreement: Agreement between countries to reduce trade barriers and increase trade flow.
| Concept | Advantages | Disadvantages |
|---|---|---|
| Becoming an MNC | Avoid some trade barriers, access resources, closer to markets, lower production costs in some countries, possible grants. | High setup cost, cultural/language barriers, time-zone communication issues, host-country restrictions, training gaps. |
| MNC impact on host country | GDP growth, tax revenue, jobs, technology and managerial skill transfer, more competition and productivity. | Resource depletion, profit repatriation, labour exploitation risk, pollution/deforestation, pressure on infant industries. |
| Trade agreements | Wider input choice, faster industrialisation, quality competition, comparative advantage, higher living standards. | Domestic firms face tougher competition; weaker sectors may shrink without adaptation. |
Role of technology in trade: Blockchain (transaction tracking), AI (route optimization/translation), digital platforms (cross-border communication), mobile payments (faster e-commerce).
Short evaluation: International expansion can be highly rewarding, but only when firms manage local legal, cultural, labour, and environmental risks well. Host countries gain most when regulation is strong and skill transfer is real.
Mind Map - International Influences
MNC Motives
- Market access
- Lower cost
- Resource access
Host Country Benefits
- Jobs
- Taxes
- Skills
- GDP rise
Host Country Risks
- Profit outflow
- Resource depletion
- Pollution
- Infant industry pressure
Trade Tech
- Blockchain
- AI
- Digital platforms
- Mobile payments
Chapter 2 - External Economic Influences on Business Activity
Key definitions: GDP = total value of final goods/services in a year; Inflation = sustained rise in general prices; Deflation = fall in general prices; Unemployment = willing and able workers without jobs; BOP = value of exports minus imports; Exchange rate = value of one currency in terms of another.
Government macro objectives: stable growth, low inflation, low unemployment, favorable BOP, exchange-rate stability, fair income distribution.
| Economic topic | Advantages / Positive effects | Disadvantages / Negative effects |
|---|---|---|
| Economic growth | Higher living standards, more jobs, higher tax revenue, poverty reduction, attracts investment. | Can bring inflation, wage pressure, pollution, monopolies, and labour displacement via automation. |
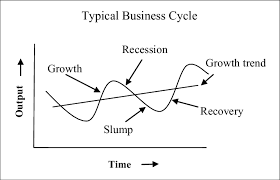
| Boom vs recession cycle | Boom can raise profits; boom can improve employment; recession can create low-cost asset buying opportunities. | Boom can cause overheating and inflation; recession cuts demand and profits; slump creates large job losses. |
| Inflation (low/stable) | Easier to pass costs to customers; real debt burden can fall; inventory/asset values may rise. | High inflation cuts real wages, causes disputes, increases borrowing costs, weakens export competitiveness. |
| Deflation | Can reduce some input costs; can improve buyer purchasing power; can increase value-for-money image for careful firms. | Customers delay purchases; business revenue and margins fall; investment and confidence decline. |
| Exchange-rate appreciation | Imported raw materials become cheaper; imported machinery becomes cheaper; import-dependent firms can widen margins. | Exports become expensive abroad; tourism inflow may fall; local firms lose share to cheap imports. |
| Exchange-rate depreciation | Exports become price-competitive; domestic substitutes become more attractive; firms can gain local market share from importers. | Imported inputs become expensive; imported inflation can rise; firms with foreign debt face higher repayment burden. |
| Fiscal and monetary policy | Expansionary policy can lift recession; contractionary policy can control overheating inflation. | Policy lag and wrong timing can worsen instability; interest-rate changes affect investment strongly. |
| Market failure | Government action can improve outcomes (pollution controls, training support, competition laws). | Without intervention: overproduction (external costs) or underproduction (skills, fair competition). |
| Income elasticity of demand | Helps predict demand by good type (luxury, normal, inferior) during cycle changes. | Wrong elasticity assumptions can lead to poor stock/output decisions. |
Short evaluation: Economic indicators create both risks and opportunities. Best strategy is to track cycle indicators early, align product mix using income elasticity, and prepare flexible pricing, cost, and investment plans.
Recovery -> Boom -> Recession -> Slump -> Recovery
Cost-Push (costs rise) + Demand-Pull (demand rises) -> Price level rises
Recession -> Expansionary Fiscal/Monetary | Overheating -> Contractionary Policies
Flowchart Mind Map - Chapter 2
Macro Objectives -> Growth | Inflation | Unemployment | BOP | Exchange Rate
Business Cycle -> Boom -> Recession -> Slump -> Recovery
Price Level -> Inflation (Cost-push/Demand-pull) -> Policy Response (Fiscal/Monetary)
External Sector -> BOP -> Exchange Appreciation/Depreciation -> Winners/Losers
Market Failure -> External costs | Skills under-provision | Monopoly -> Government correction
Chapter 3 - Introduction to Business Strategy
Strategy: Long-term plan of how a business moves from current position to future goals.
Corporate strategy: Whole-business direction (which markets/products to be in).
Tactics: Short/medium-term actions that implement strategy at department level.
Strategic management: Setting long-term goals and implementing cross-functional decisions to achieve them.
Competitive advantage: Ability to deliver better value or lower cost than rivals.
| Concept | Advantages | Disadvantages |
|---|---|---|
| Formal strategic planning | Gives clear direction; improves opportunity/threat response; aligns scarce resources to long-term goals. | Can become rigid; wrong assumptions can mislead plans; planning can be time-consuming and costly. |
| Corporate / business / functional hierarchy | Creates role clarity; improves accountability; supports coordinated execution across departments. | Can slow decisions; may create communication gaps; can increase internal bureaucracy. |
| Strategy vs tactics separation | Clarifies long-term vs short-term actions; improves priority setting; helps performance measurement. | Over-focus on tactics can dilute strategy; poor alignment wastes resources; teams may work in silos. |
| Structure follows strategy | Supports expansion/diversification; improves control over regions/products; can increase flexibility with decentralization. | Restructuring costs can be high; change can confuse staff; temporary disruption may reduce performance. |
| Competitive advantage focus | Supports higher margins; protects market share; creates stronger brand preference. | Hard to sustain due to imitation; requires continuous innovation spend; failure can quickly weaken position. |
Short evaluation: A strategy is only useful when structure, resources, and daily tactics all support it. Businesses that fail to align these three often lose competitive advantage even with good ideas.
Corporate Strategy -> Business Strategy -> Functional Strategy
Analysis -> Choice -> Implementation
Flowchart Mind Map - Chapter 3
Strategic Management -> Analysis -> Choice -> Implementation
Hierarchy -> Corporate Strategy -> Business Strategy -> Functional Strategy
Decisions -> Strategic (long-term, cross-functional) -> Tactical (short-term, departmental)
Competitive Advantage -> Lower Cost | Differentiation -> Better performance
Chapter 4 - Strategic Analysis
Strategic analysis: Research into internal and external environment to design future strategies.
Blue ocean strategy: Create uncontested market space instead of fighting existing competition.
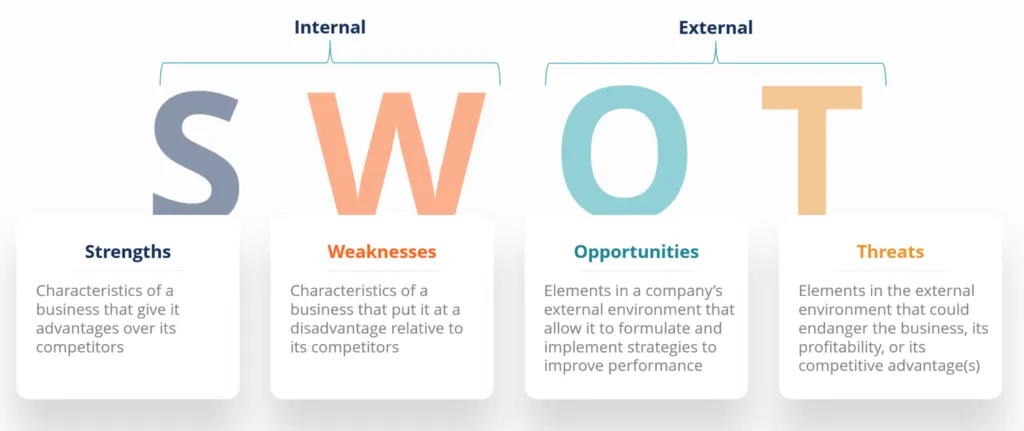
SWOT: Strengths, Weaknesses (internal), Opportunities, Threats (external).
PEST: Political, Economic, Social, Technological macro-environment scan.
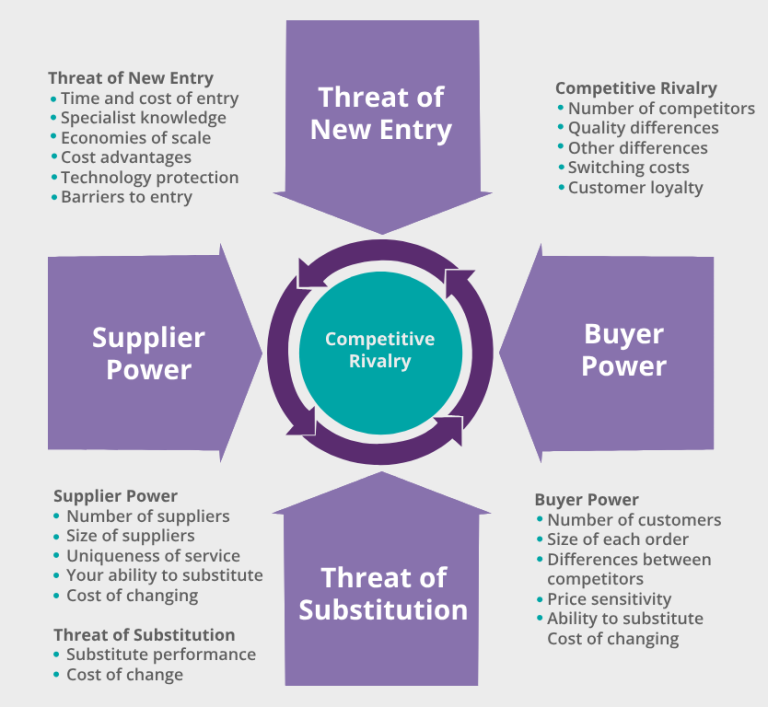
Porter five forces: Industry analysis using entry barriers, buyer power, supplier power, substitutes, rivalry.
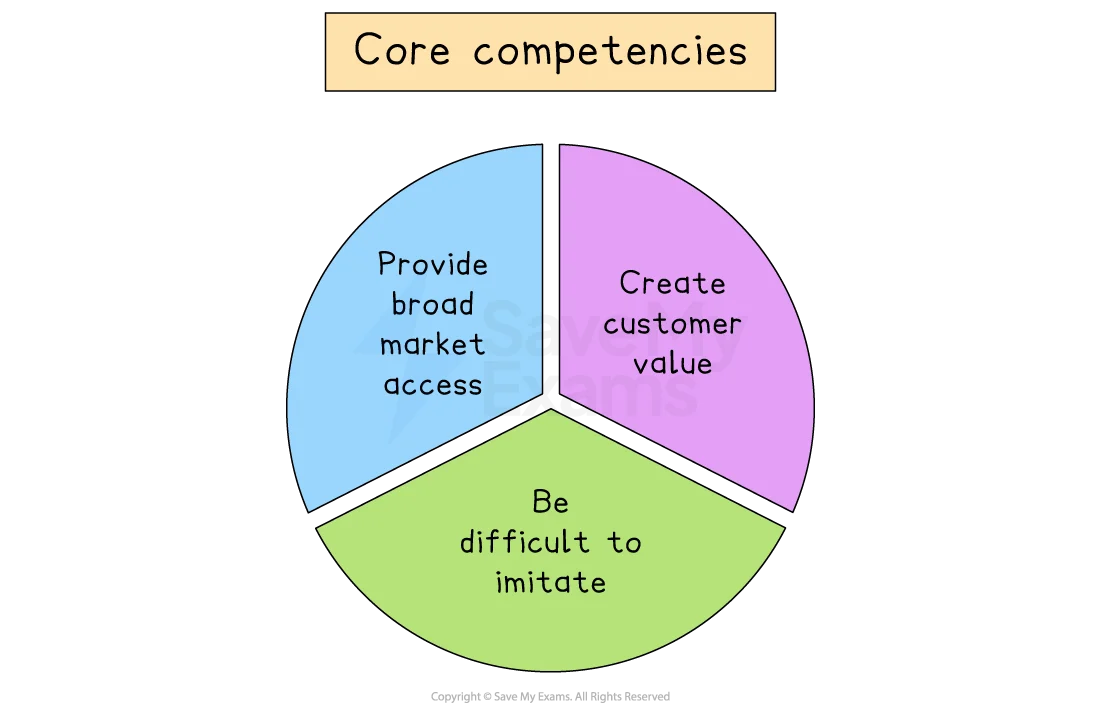
Core competency: Unique, hard-to-copy capability that gives sustained advantage and can be applied across products/markets.
| Analysis tool | Advantages | Disadvantages |
|---|---|---|
| Blue Ocean | Creates uncontested demand; reduces direct rivalry; allows premium positioning through innovation. | High uncertainty; requires education of customers; failure risk is high if execution is weak. |
| Scenario planning | Improves risk awareness; builds flexible strategy options; prepares managers for uncertainty. | Can become too broad/confusing; may miss black-swan events; depends on management quality. |
| SWOT | Easy to use; links internal and external factors; good starting point for discussion. | Subjective scoring; no direct quantification; may oversimplify complex issues. |
| PEST | Improves macro-environment scanning; supports international decisions; highlights non-market risks early. | Needs constant updates; can generate too much data; weak if not linked to action plans. |
| Porter Five Forces | Explains profit pressure in an industry; identifies where power sits; supports entry/exit decisions. | Static snapshot view; less accurate in fast tech markets; complex in multi-segment industries. |
| Core competency analysis | Builds long-term differentiation; supports new core products; hard for rivals to copy if protected. | Takes time to develop; needs high investment and talent; can become obsolete with market shifts. |
Short evaluation: No single model is enough on its own. Strong strategic analysis combines multiple tools and then converts insights into realistic choices based on resources and competitive pressure.
Internal -> Strengths + Weaknesses | External -> Opportunities + Threats
Entry + Buyers + Suppliers + Substitutes -> Rivalry Intensity
Raise -> Reduce -> Eliminate -> Create
Flowchart Mind Map - Chapter 4
Start -> Strategic Analysis -> Internal Scan + External Scan
Internal Scan -> SWOT (S/W) -> Core Competencies
External Scan -> PEST + Five Forces + Scenario Planning
Innovation Route -> Blue Ocean (Raise/Reduce/Eliminate/Create)
Output -> Better strategic options and risk awareness
Chapter 5 - Strategic Choice
Strategic choice: Selecting the best option from alternative strategies after analysis.
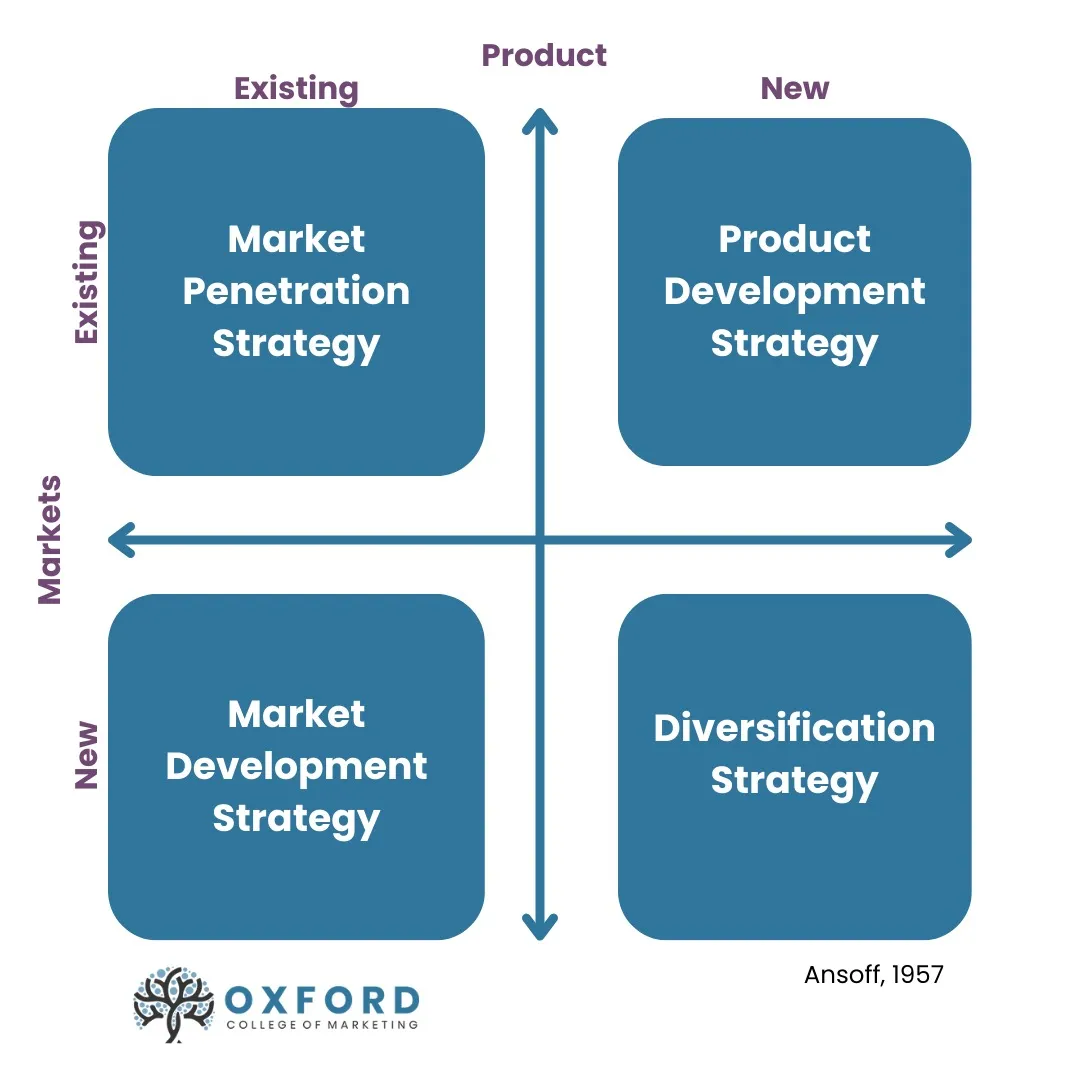
Ansoff Matrix: Growth options by market/product combination: market penetration, product development, market development, diversification.
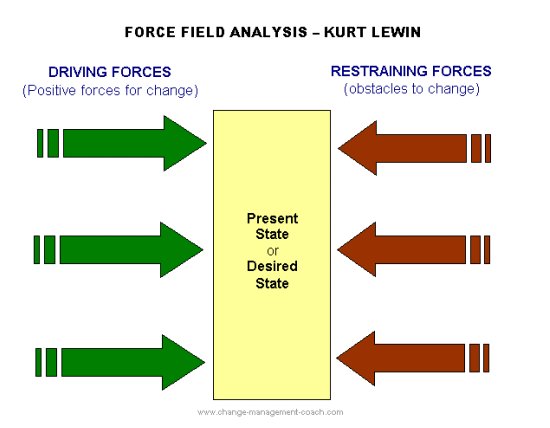
Force-field analysis: Compares driving vs restraining forces for a decision/change.
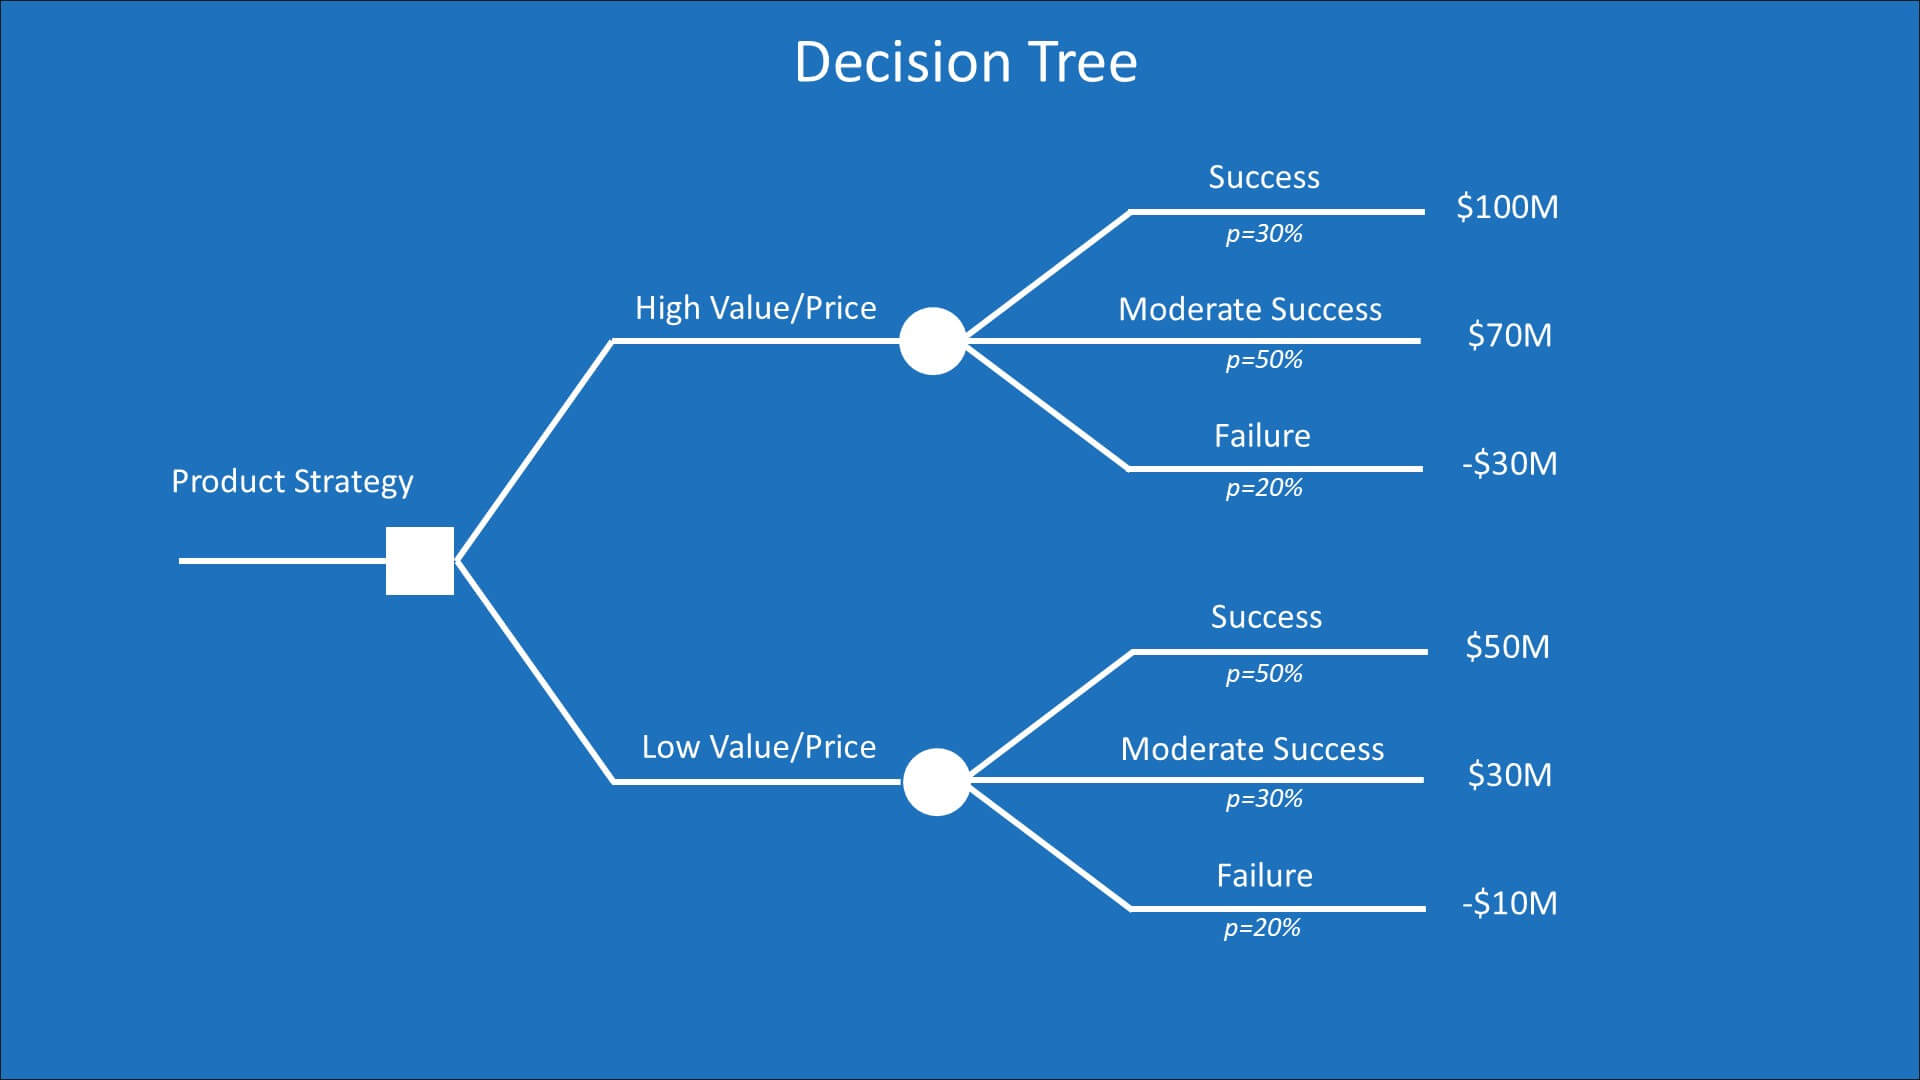
Decision tree: Quantitative tool mapping options, probabilities, outcomes, and expected returns.
| Choice tool | Advantages | Disadvantages |
|---|---|---|
| Ansoff Matrix | Shows clear growth options; compares risk levels; supports strategic discussion quickly. | No detailed execution method; manager judgement bias can distort risk; ignores competitor reaction detail. |
| Force-field analysis | Clarifies support vs resistance; improves change planning; helps design actions to reduce barriers. | Scoring is subjective; some forces may be missed; outcomes depend on manager experience. |
| Decision trees | Quantifies risk and return; compares alternative paths logically; supports evidence-based choices. | Forecast data can be inaccurate; probabilities can change over time; qualitative impacts may be underweighted. |
Short evaluation: Strategic choice should combine numbers and judgement. Firms that rely only on expected values but ignore culture, risk appetite, or workforce impact can choose strategies that look good on paper but fail in practice.
Existing Product + Existing Market = Penetration
New Product + Existing Market = Product Development
Existing Product + New Market = Market Development
New Product + New Market = Diversification
Driving Forces >>> | CHANGE | <<< Restraining Forces
Option A/B -> Chance Outcomes -> Probability -> Expected Value
Flowchart Mind Map - Chapter 5
Strategic Options -> Ansoff (Penetration | Product Dev | Market Dev | Diversification)
Change Feasibility -> Force-field (Driving forces vs Restraining forces)
Risk + Return -> Decision Tree (Probabilities -> Expected values)
Final Selection -> Best fit with objectives, resources, and risk tolerance
Chapter 6 - Strategic Implementation
Strategic implementation: Planning, allocating, and controlling resources to execute chosen strategy.
Corporate planning: Written plan covering objectives, strategy, operations, team, and financial forecasts.
Corporate culture: Shared values and beliefs that shape behavior and decision-making.
Transformational leadership: Leadership that inspires people to adopt and deliver strategic change.
Contingency planning: Plan B and crisis actions for unexpected disruptions.
| Implementation area | Advantages | Disadvantages |
|---|---|---|
| Corporate planning | Gives direction and targets; improves communication; supports control through planned vs actual comparison. | Can be rigid; assumptions may be subjective; revision is time-consuming in dynamic markets. |
| Strong/appropriate culture | Aligns behaviour; supports faster implementation; improves customer/staff consistency. | Culture change is slow; may face internal resistance; can require costly retraining and reward redesign. |
| Transformational leadership | Builds trust and motivation; improves change acceptance; encourages higher employee performance. | Needs strong leader quality; poor communication raises anxiety; inconsistent leadership causes confusion. |
| Change management process | Improves readiness; reduces resistance; creates quick wins and implementation momentum. | Poor handling creates fear; low trust slows adoption; productivity can fall during transition. |
| Contingency planning | Protects continuity; reduces crisis losses; safeguards reputation and customer confidence. | Needs regular drills and updates; creates additional cost; some low-probability events are hard to predict. |
Short evaluation: Strategy fails most often at implementation stage, not idea stage. Success needs aligned culture, strong communication, visible leadership support, and practical contingency plans for shocks.
Need for Change -> Vision -> Resources -> Training -> Quick Wins -> Full Rollout
Fear of Unknown + Fear of Failure + Low Trust + Inertia
Risk Identify -> Likelihood Assess -> Plan B -> Crisis Response -> Continuity
Flowchart Mind Map - Chapter 6
Chosen Strategy -> Corporate Plan -> Resource Allocation -> Department Action
People Side -> Culture setup -> Transformational leadership -> Employee buy-in
Change Control -> Evolutionary/Revolutionary change -> Training + Communication
Resistance Management -> Fear/Trust/Inertia issues -> Support + Participation
Risk Protection -> Contingency plan -> Crisis response -> Business continuity
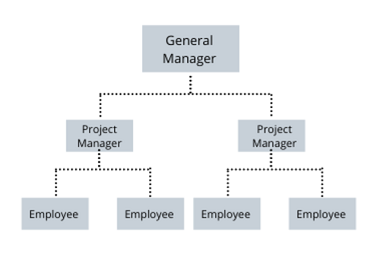
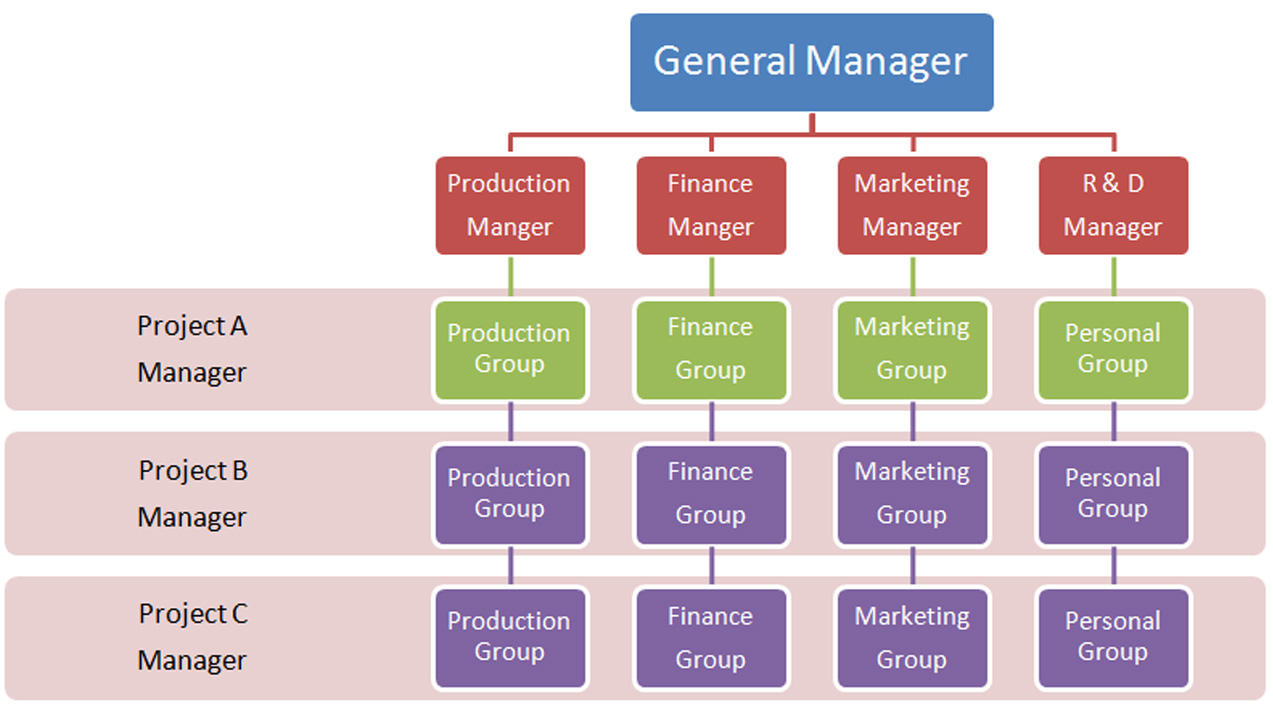
Chapter 7 - Organisation Structure
Organisation structure: Formal internal framework showing authority, reporting lines, communication routes, chain of command, and span of control.
Key terms: Hierarchy = levels of rank; Delegation = passing authority down; Centralisation = decisions at top; Decentralisation = decisions pushed down; Delayering = removing management levels.
| Structure concept | Advantages | Disadvantages |
|---|---|---|
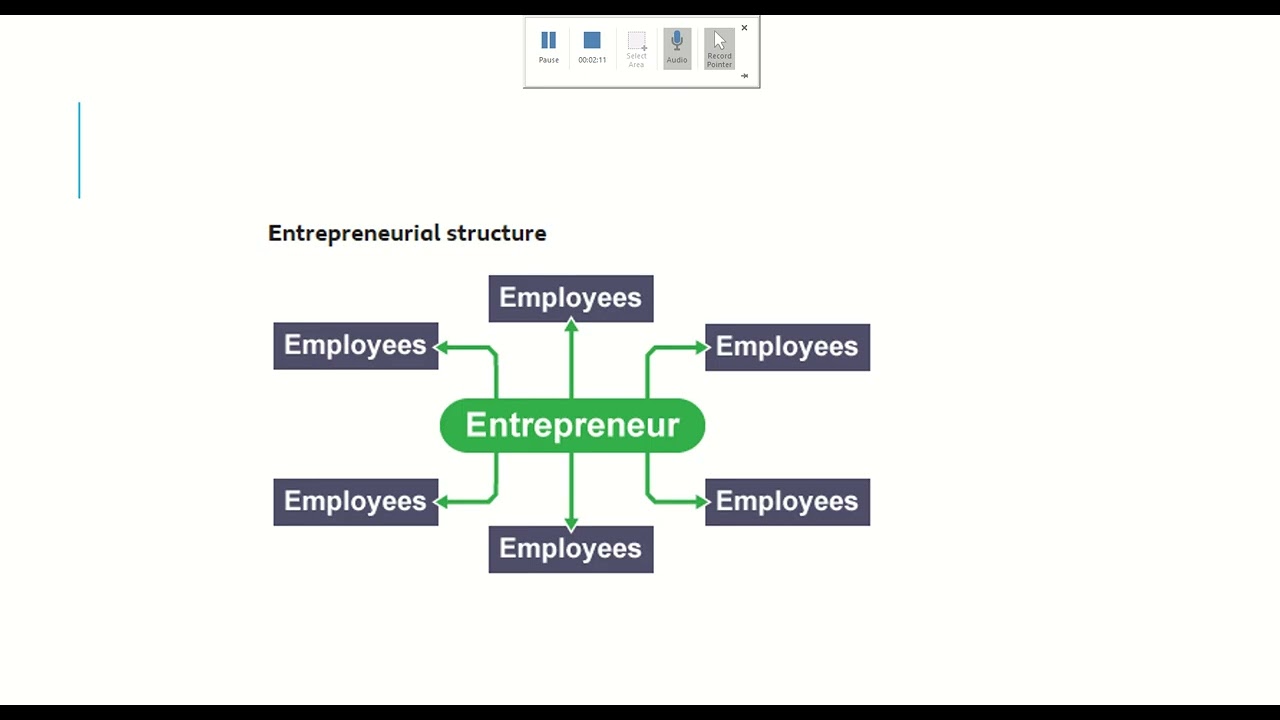
| Functional structure | Builds specialist skills; improves department efficiency; gives clear responsibility in each function. | Can create silos; inter-department coordination is weak; staff may feel distant from top managers. |
| Hierarchical/bureaucratic | Clear command chain; defined authority roles; easy to understand promotion paths. | One-way communication risk; slower responses to change; weak horizontal links. |
| Matrix structure | Cross-functional teamwork; better innovation and idea-sharing; faster project-focused responses. | Role conflict is common; senior managers may resist power-sharing; dual reporting can confuse staff. |
| Divisional (product/geography) | Focuses on local markets; faster responses to segment needs; performance can be measured division-wise. | Role duplication raises cost; rivalry between divisions; reduced central control. |
| Delegation & decentralisation | Higher motivation and empowerment; better local decisions; frees top managers for strategic work. | Needs training and trust; inconsistent decisions possible; managers may fear loss of control. |
Short evaluation: Best structure depends on objectives, size, market dynamics, and management style. Businesses often blend structures and adjust over time (especially with growth and competition).
More Levels -> Longer chain -> Narrower span | Fewer Levels -> Shorter chain -> Wider span
Authority + Responsibility + Accountability must stay aligned

Flowchart Mind Map - Chapter 7
Structure Basics -> Hierarchy | Chain of Command | Span of Control | Delegation
Design Choices -> Functional | Hierarchical | Matrix | Divisional
Power Choices -> Centralisation vs Decentralisation
Improvement -> Delayering | Empowerment | Better communication systems
Chapter 8 - Business Communication
Effective communication: Clear message transfer with appropriate medium and feedback so receiver understands and can act correctly.
Communication chain: Sender -> clear message -> medium -> receiver -> feedback.
| Communication area | Advantages | Disadvantages |
|---|---|---|
| Oral communication | Fast interaction; immediate feedback; useful for motivation and clarifying issues. | No permanent record; message can be misheard; depends heavily on delivery/body language. |
| Written communication | Permanent record; legal clarity; can be rechecked for accuracy. | Slower feedback; may be ignored; no guarantee message was understood. |
| Electronic/IT media | High speed and reach; low sending cost; useful for global teams and customer tracking. | Information overload risk; cyber/security issues; weaker human connection. |
| Two-way communication | Improves understanding; boosts participation; supports democratic culture. | Time-consuming; can delay urgent instructions; meetings may reduce active work time. |
| Informal communication | Builds relationships; spreads ideas quickly; helps identify issues early. | Rumours and exaggeration; can distort formal messages; may reduce control of information. |
Short evaluation: No single medium is always best. Strong businesses choose communication method by message purpose, urgency, legal need, and feedback importance.
One-way | Two-way | Horizontal | Vertical
Wrong medium + overload + jargon + long chain + low trust + poor environment
Flowchart Mind Map - Chapter 8
Effective Communication -> Clear message + right medium + feedback
Media -> Oral | Written | Electronic | Visual
Directions -> Vertical | Horizontal | One-way | Two-way
Control -> Remove barriers -> build trust -> keep channels short
Chapter 9 - Leadership
Leadership: Influencing and guiding people to achieve business goals, especially during change.
Emotional intelligence (EI): Ability to understand and manage your own emotions and others’ emotions for better decisions and relationships.
| Leadership approach | Advantages | Disadvantages |
|---|---|---|
| Trait/Great-person view | Highlights key personal qualities; helps identify natural leadership strengths; useful for role selection. | Overlooks training potential; too deterministic; may ignore context. |
| Behavioural/learned leadership | Leadership can be developed; supports training programs; adaptable skills improve performance. | Training takes time and cost; not all trainees perform equally; may ignore situational constraints. |
| Contingency leadership | Fits style to situation; improves flexibility; better for changing teams/tasks. | Complex to apply; requires strong judgement; wrong diagnosis can fail quickly. |
| Transactional leadership | Clear targets; direct reward-punishment link; useful for short-term output control. | Can reduce intrinsic motivation; may limit creativity; over-focus on compliance. |
| Transformational leadership | Builds commitment to vision; increases motivation and innovation; supports cultural change. | Depends on leader quality; can fail without trust; high emotional demand on leaders. |
Short evaluation: Effective leaders combine styles. In stable tasks, transactional methods can work; in major change, transformational and emotionally intelligent leadership is usually stronger.
Self-awareness -> Self-management -> Social awareness -> Social skills
Flowchart Mind Map - Chapter 9
Leadership Theories -> Trait | Behavioural | Contingency | Power/Influence
Style Spectrum -> Transactional -> Transformational
Modern Success Factors -> EI + communication + integrity + adaptability
Chapter 10 - Human Resource Management Strategy
Hard HRM: Cost-focused management of labour (flexible contracts, low training, tight control).
Soft HRM: People-development approach focused on motivation, commitment, and long-term capability.
MBO: Management by Objectives - corporate goals broken into departmental and individual targets.
| HR strategy area | Advantages | Disadvantages |
|---|---|---|
| Hard HRM | Lower immediate labour cost; higher contract flexibility; easier short-term cost control. | Lower motivation; higher turnover; possible negative employer reputation. |
| Soft HRM | Higher commitment; better long-term productivity; stronger retention and culture. | Higher training/investment cost; slower short-term returns; needs supportive management. |
| Flexible contracts (part-time/temp/flexi) | Covers seasonal demand; reduces idle labour cost; broadens hiring options. | Weaker team cohesion; communication complexity; job insecurity concerns. |
| MBO | Clear targets; stronger coordination; better performance control and appraisal. | Target-setting is time-consuming; objectives can become outdated; can fail without resources/training. |
| IT/AI in HR | Faster recruitment filtering; better performance tracking; scalable training and HR support (chatbots/VR). | Bias/privacy concerns; high setup cost; still needs human supervision and judgement. |
Short evaluation: The best HR strategy is usually blended: flexibility where needed, but strong investment in core talent and fair treatment to sustain productivity and reputation.
Flowchart Mind Map - Chapter 10
HR Approaches -> Hard HRM vs Soft HRM
Contracts -> Part-time | Temporary | Flexi-time | Permanent | Outsourcing | Shift Work
Performance -> Productivity | Absenteeism | Quality complaints
Improvement Tools -> Appraisal | Training | Quality circles | MBO | IT/AI systems
Chapter 11 - Marketing Analysis
Price elasticity of demand (PED): Responsiveness of demand to price changes.
Income elasticity (YED): Responsiveness of demand to income changes.
Cross elasticity (XED): Responsiveness of demand for one product to another product’s price changes.
Promotional elasticity: Responsiveness of demand to promotional spending changes.
| Marketing analysis tool | Advantages | Disadvantages |
|---|---|---|
| Elasticity analysis | Improves pricing decisions; supports market segmentation; helps forecast demand shifts. | Assumes ceteris paribus; changes quickly over time; data may be outdated/inaccurate. |
| NPD process | Reduces launch risk via staged testing; aligns product with customer needs; improves innovation discipline. | Time-consuming; costly research/testing; go/drop errors still possible. |
| R&D investment | Creates innovation pipeline; strengthens brand image; can produce long-term competitive advantage. | Very expensive; high uncertainty of returns; payback often delayed. |
| Sales forecasting | Improves planning across marketing/operations/finance/HR; lowers stock/capacity mismatch risk; supports faster tactical responses. | Forecast error risk is high; external shocks can invalidate models; should not be the only decision input. |
Short evaluation: Marketing analysis tools are powerful for direction, but they are estimates, not certainty. Best use comes from combining quantitative models with market judgement.
YED: + normal, - inferior, 0 necessity | XED: + substitutes, - complements, 0 unrelated
Idea -> Screening -> Concept -> Analysis -> Prototype -> Test Market -> Commercialisation
Flowchart Mind Map - Chapter 11
Demand Tools -> PED | YED | XED | Promotional Elasticity
Innovation Tools -> NPD + R&D (offensive/defensive)
Forecasting -> Quantitative + Qualitative methods
Decision Impact -> Marketing + Operations + Finance + HR
Chapter 12 - Marketing Planning and Strategy
Marketing plan: Detailed written document setting marketing objectives, strategies, tactics, budgets, and review controls.
Core planning questions: Where are we now? Where do we want to be? How will we get there? Are we on course?
| Planning component | Advantages | Disadvantages |
|---|---|---|
| Situational analysis (mission, PEST, SWOT, competitor/market scan) | Clarifies starting position; improves strategic fit; reduces avoidable mistakes. | Research can be expensive; time-intensive; data may become outdated quickly. |
| Clear objectives + strategy + marketing mix | Gives direction; aligns activities across product/price/promotion/place; supports control of outcomes. | Poor objective quality causes weak plans; budget limits strategy options; strategy may conflict with resources. |
| Review and control process | Supports early corrections; allows learning from consumer feedback; improves future plans. | Can create rigidity if managers over-attach to original plan; frequent changes can be costly; review quality depends on data quality. |
| IT/AI in marketing planning | Faster targeting; better personalization; stronger real-time insights and campaign optimization. | Privacy concerns; technology dependence; high data/skills investment needed. |
Short evaluation: A marketing plan improves success probability, but flexibility is critical. The strongest plans are data-driven yet adaptable when market conditions shift.
Flowchart Mind Map - Chapter 12
Plan Logic -> Situation -> Objectives -> Strategy -> Mix -> Budget -> Review
Situation Tools -> Mission | PEST | SWOT | Competitor | Target market
Success Conditions -> Consistency + Coordination + Focus + Flexibility
Chapter 13 - Globalization and International Marketing
Globalisation: Increasing global interconnection of trade, capital, labour, technology, and culture.
International marketing: Selling and managing marketing in markets outside the home country.
| International strategy area | Advantages | Disadvantages |
|---|---|---|
| Globalisation effects | Larger markets; more efficiency pressure and innovation; easier cross-border expansion options. | Stronger foreign competition; local firms can be displaced; communication/control complexity rises. |
| Entry methods (export/licensing/subsidiary) | Export gives flexible entry; licensing lowers production relocation burden; subsidiaries give higher control and long-term presence. | Export logistics/agent issues; licensing quality risks; subsidiaries need heavy capital and regulatory management. |
| Pan-global standardisation | Strong global brand consistency; economies of scale in production/marketing; faster rollout across markets. | Cultural mismatch risk; legal differences across countries; one-price/one-message approach may fail locally. |
| Global localisation | Better local fit; stronger acceptance by local customers; improved legal/cultural alignment. | Higher adaptation costs; weaker global brand consistency; fewer scale economies. |
Short evaluation: There is no universal global strategy. Firms should choose position on the standardisation-localisation spectrum based on cultural, legal, and economic differences of each target market.
Flowchart Mind Map - Chapter 13
Globalisation -> More trade + mobility + interdependence
Market Entry -> Export | Licensing | Subsidiary | JV/Franchise
Strategy Choice -> Pan-Global vs Global Localisation
Decision Drivers -> Cultural + Legal + Economic + Business-practice differences
Chapter 14 - Location and Scale
Optimal location: Site that gives best long-term mix of quantitative and qualitative factors to maximize profit.
Scale of operation: Maximum output possible with available resources; increased in long run by increasing all factors of production.
| Operations decision | Advantages | Disadvantages |
|---|---|---|
| Strong location choice | Improves access to labour/markets; can lower transport and input costs; can increase sales potential. | Prime sites have high fixed costs; wrong location can reduce demand; relocation later is expensive. |
| Large scale + internal economies | Bulk-buying savings; technical and financial efficiencies; stronger marketing and specialist management gains. | Can trigger diseconomies; high expansion cost/opportunity cost; greater coordination complexity. |
| External economies (cluster benefits) | Better infrastructure; access to skilled labour pool; stronger supplier and knowledge networks. | Rising rents/land prices; congestion and transport pressure; cost inflation in cluster regions. |
| Deliberate demerger/decentralisation to reduce diseconomies | Improves control in units; reduces bureaucracy; improves responsiveness. | Can reduce scale benefits; duplicate overheads may rise; transition costs can be significant. |
Short evaluation: The best location and scale choice is a balance decision, not a maximum decision. Businesses must weigh cost advantages against coordination, labour, and market-access realities.
Flowchart Mind Map - Chapter 14
Location Factors -> Site/Labour/Transport/Sales potential/Government grants
Scale Growth -> More inputs -> More output -> Economies or Diseconomies
Economies -> Purchasing | Technical | Financial | Marketing | Managerial
Control -> MBO + decentralisation + structure redesign
Chapter 15 - Quality Management
Quality: Product/service fitness for purpose and ability to meet customer expectations.
Quality control: Inspection-focused checking, mainly at or near final output.
Quality assurance: Process-based quality checks at each stage to prevent defects.
TQM: Total Quality Management - whole-organisation culture where everyone is responsible for quality improvement.
| Quality system | Advantages | Disadvantages |
|---|---|---|
| Quality control | Finds faults before market release; protects brand from severe defects; useful for safety-critical outputs. | Inspection is costly; can create blame culture; faults may be found too late after added costs. |
| Quality assurance | Prevents defects early; builds shared responsibility; reduces rework and final-inspection burden. | Needs training and discipline; setup and monitoring costs; supplier quality compliance may be difficult. |
| TQM culture | Drives continuous improvement; supports zero-defect mindset; increases customer loyalty and premium potential. | Cultural change takes time; needs strong leadership commitment; weak implementation can fail. |
| Benchmarking | Sets clear performance targets; exposes improvement gaps; supports accountability and process standardisation. | Data access can be difficult; comparisons may be imperfect; can encourage copying over innovation. |
Short evaluation: Quality systems add cost upfront but usually reduce total long-run cost through fewer defects, stronger brand trust, and repeat demand.
Flowchart Mind Map - Chapter 15
Quality Goal -> Fit for purpose + customer satisfaction
Methods -> Quality Control vs Quality Assurance vs TQM
Support -> Supplier quality + process checks + employee ownership
Improvement -> Benchmark -> Set standards -> Re-measure continuously
Chapter 16 - Operations Strategy
Operations planning: Preparing inputs/resources to supply output that matches expected demand.
Operational flexibility: Ability to change output level and product range as demand changes.
Lean production: Producing with minimal waste while maintaining high quality.
| Operations strategy tool | Advantages | Disadvantages |
|---|---|---|
| CAD/CAM adoption | Higher precision; faster development and production; easier product variant handling. | High software/hardware/training cost; breakdown risk; shortage of skilled operators. |
| ERP systems | Integrated data across departments; better inventory/costing/planning; faster decision support. | Expensive implementation; long setup time; organisational resistance to common processes. |
| Lean production methods (JIT, cell production, Kaizen, simultaneous engineering) | Lower waste and inventory; faster cycle time; improved quality and worker ownership. | Needs culture change; vulnerable to demand/supply shocks; retraining and transition costs. |
| AI in operations | Automation of repetitive tasks; better scheduling/fraud/security detection; stronger predictive capability. | High investment; quality still needs human oversight; ethical/data concerns persist. |
Short evaluation: Operations strategy must align with demand uncertainty, finance capacity, and workforce capability. Lean and digital systems are powerful only when implementation quality is high.
Flowchart Mind Map - Chapter 16
Strategic Decisions -> Capacity | Location | Outsourcing | Process method | Tech adoption
Digital Ops -> CAD + CAM + ERP + AI
Flexibility -> Output variation + product variation + adaptable workforce/machines
Lean -> Remove waste -> Improve quality -> Continuous improvement (Kaizen)
Chapter 17 - Operations Planning and Project Management
Project: Temporary, goal-focused activity with defined scope, time, budget, and responsibilities.
Project management: Planning and controlling project resources, schedule, quality, and cost from start to finish.
CPA: Critical Path Analysis - network planning tool that sequences activities and identifies minimum completion time and critical tasks.
| Project tool/approach | Advantages | Disadvantages |
|---|---|---|
| Structured project phases | Clear accountability; better resource allocation; easier progress control. | Can become bureaucratic; delays if approvals are slow; poor planning still causes failure. |
| CPA / network analysis | Shows critical tasks and deadlines; improves scheduling and resource timing; supports control through EST/LFT and float. | Depends on quality of duration estimates; complex networks need skilled setup; cannot guarantee success alone. |
| Using float and resource reallocation | Improves utilisation; helps recover delays on critical tasks; reduces penalty-risk from late completion. | Resource shifting can disrupt non-critical tasks; requires strong management judgement; may increase stress on teams. |
| Matrix project teams | Cross-functional expertise; stronger coordination on complex projects; faster issue resolution. | Dual authority tensions; role conflict possible; needs excellent communication discipline. |
Short evaluation: CPA is a strong planning and control tool, but project success still depends on realistic estimates, skilled managers, committed teams, and disciplined execution.
Initiation -> Planning -> Execution -> Monitoring/Control -> Closure
Activities + Dependencies -> Network -> Critical Path -> Float-based control
Flowchart Mind Map - Chapter 17
Project Basics -> Scope + Time + Cost + Resources
Control Method -> CPA steps (identify -> sequence -> time -> critical path -> control)
Execution -> Track progress vs plan -> adjust resources -> meet deadline
Review -> Learn from results -> improve next project
Chapter 18 - Financial Statements
Income statement (statement of profit or loss): Shows revenue, costs, and profit for a period.
Statement of financial position (balance sheet): Snapshot of assets, liabilities, and shareholders’ equity at a point in time.
Key terms: Assets = resources with value; Liabilities = obligations; Equity = assets - liabilities; Depreciation = reduction in asset value over time.
| Financial statement area | Advantages | Disadvantages |
|---|---|---|
| Income statement use | Tracks profitability trends; supports cost control; helps tax and budget planning. | Can include one-off low-quality profits; historical snapshot only; may not predict future performance well. |
| Statement of financial position use | Shows business solvency/wealth; supports financing decisions; helps assess liquidity and capital structure. | Values can be judgement-based; intangible assets often undervalued; window dressing risk exists. |
| Inventory valuation (lower of cost or NRV) | Conservative reporting; avoids overstating assets; improves credibility of accounts. | Requires estimates; can reduce reported profit; valuation disputes may occur. |
| Depreciation accounting | Matches asset usage with cost over time; improves realistic profit reporting; supports replacement planning. | Method choice affects reported profit; involves assumptions (useful life/residual value); not a cash expense but can confuse users. |
Short evaluation: Financial statements are essential for control and external trust, but users must analyse quality of figures, assumptions, and one-off items before concluding performance.
Assets = Liabilities + Shareholders' Equity
Revenue -> Gross Profit -> Operating Profit -> Profit After Tax -> Retained Earnings
Flowchart Mind Map - Chapter 18
Records -> Income statement + Statement of financial position
Asset Control -> Inventory valuation + Depreciation + Intangibles
Risk Check -> Published account limits + possible window dressing
Chapter 19 - Analysis of Published Accounts
Ratio analysis: Interpreting accounting data by comparing related figures to assess liquidity, profitability, efficiency, gearing, and investment attractiveness.
| Ratio group | Advantages | Disadvantages |
|---|---|---|
| Liquidity ratios (current, acid-test) | Shows short-term debt paying ability; warns about insolvency risk early; supports working capital control. | Can be distorted by slow-moving inventory/debtors; ideal level differs by industry; one year data is limited. |
| Profitability ratios (GPM, OPM, ROCE) | Measures management efficiency; helps compare with rivals/previous years; links returns to invested capital. | Affected by accounting policies; ignores non-financial performance; may hide quality-of-profit issues. |
| Efficiency ratios (inventory/debtor/creditor days) | Improves cashflow management; identifies operational bottlenecks; supports better credit control policy. | Formula assumptions may vary; industry comparisons can be misleading; can conflict between marketing and finance aims. |
| Gearing and investment ratios | Shows financial risk level; informs debt/equity choices; helps shareholders judge return attractiveness. | High gearing can boost returns but increase risk; share prices can move for external reasons; ratios alone do not prove value. |
Short evaluation: Ratios are decision aids, not answers. The strongest analysis uses trend + competitor comparison + qualitative context (market, strategy, governance, ethics).
Liquidity | Profitability | Efficiency | Gearing | Investment
Flowchart Mind Map - Chapter 19
Published Accounts -> Compute key ratios
Compare -> Past trend + competitor benchmark + industry context
Interpret -> Identify problems -> design corrective strategy
Chapter 20 - Investment Appraisal
Investment appraisal: Evaluating desirability and financial feasibility of long-term projects before committing funds.
Discounting: Converting future cashflows into present value because of time value of money and risk.
| Appraisal method | Advantages | Disadvantages |
|---|---|---|
| Payback period | Simple and quick; useful for liquidity-focused firms; helps screen out very long-return projects. | Ignores post-payback cashflows; ignores overall profitability; can bias short-term decisions. |
| ARR | Uses full project life cashflows; focuses on profitability; easy to compare with target return rates. | Ignores timing of cashflows; based on forecasts; ignores time value of money. |
| Discounted payback | Includes time value of money; still intuitive for managers; better than simple payback under inflation/interest risk. | Still ignores profits after payback point; depends on discount-rate choice; can be more complex. |
| NPV | Considers timing and size of cashflows; aligns with wealth maximization; incorporates opportunity cost of capital. | Sensitive to discount-rate assumptions; harder for non-finance users; comparing projects of different scale can be tricky. |
Short evaluation: No method is perfect alone. Best practice is to combine payback + ARR/NPV and then test qualitative factors such as environment, regulation, strategic fit, and managerial judgement.
Payback + ARR + Discounted Payback + NPV (+ IRR if available)
Forecast cashflows -> Discount -> Compare projects -> Check qualitative factors -> Final choice
Flowchart Mind Map - Chapter 20
Data Needed -> Initial cost + life + residual value + annual net cashflows
Quantitative Methods -> Payback | ARR | Discounted Payback | NPV
Qualitative Checks -> Environment + planning approval + strategic fit + managerial confidence
Chapter 21 - Finance and Accounting Strategy
Annual report: Full stakeholder report including financial statements, chairman/CEO reports, auditor report, and notes to accounts.
Finance strategy impact: Major strategic decisions (debt/equity, dividend policy, growth, pricing, NPD) directly change ratio results and stakeholder confidence.
| Strategic finance decision | Advantages | Disadvantages |
|---|---|---|
| Debt financing vs equity financing | Debt avoids ownership dilution; can amplify shareholder returns in strong growth; interest is predictable. | Raises gearing and financial risk; interest burden remains in downturns; high-rate periods make debt costly. |
| Dividend policy changes | High dividends attract income investors; lower dividends can retain funds for growth; flexible tool for signalling confidence. | Dividend cuts can hurt sentiment/share price; high payouts reduce reinvestment capacity; inconsistent policy creates uncertainty. |
| Growth strategy (takeovers, expansion, rationalisation) | Can improve economies of scale; may raise long-term margins and RoCE; can strengthen market position. | Short-term ratio pressure and integration cost; restructuring risk; debt-funded growth can worsen gearing. |
| Using annual report and ratios for strategy | Improves stakeholder communication; supports evidence-based planning; highlights weak areas early. | Historic data limits prediction; accounting policy differences reduce comparability; non-financial risks may be missed. |
Short evaluation: Financial strategy should target sustainable value, not cosmetic short-term ratio improvement. The best decisions balance return, liquidity, gearing risk, and stakeholder expectations.
Flowchart Mind Map - Chapter 21
Annual Report -> Statements + CEO/Chairman + Auditor + Notes
Strategy Levers -> Debt/Equity | Dividend | Growth | Pricing | NPD
Ratio Impact -> Liquidity | Profitability | Gearing | Investor returns
Final Aim -> Long-term sustainable performance
Paper 4 Formats - Complete Exam Question Formats and Attempting Pattern
Status: PDF embed removed as requested.
Rewrite target format: I will convert the full Paper 4 content into simple-English handwritten-style notes with: question type, command words, step-by-step attempt pattern, common mistakes, and model evaluation lines.
Ready structure (will be fully populated)
- Question Type 1: How to read case + extract evidence.
- Question Type 2: 8/10/12 mark analysis structure.
- Question Type 3: Evaluation format with final judgement.
- Question Type 4: Formula-based questions with method marks.
- Question Type 5: Strategy/decision questions with balanced arguments.
- Command words: define, explain, analyse, discuss, evaluate, justify.
- Exam timing pattern, paragraph plan, and checklist before submission.
Note: I’m ready to rewrite everything exactly and completely as soon as you provide an extractable source (paste text in chunks, or add a DOCX/TXT version of the same file).
4) Social Audit, Technology & Demographics
Social Audits & CSR
Social audit: Report showing business impact on society (pollution, worker safety, sourcing, customer satisfaction, community support).
CSR: Business accepts legal and moral responsibility to stakeholders beyond shareholders.
Short evaluation: Social audits are useful when measured honestly and linked to real action. If used only for image-building, stakeholders may see it as fake CSR (greenwashing-like behavior).
Technology & IT
IT in business: Using electronic systems to collect, store, process and communicate information.
Management Information Systems (MIS): IT systems that provide data to support managerial decision-making.
Short evaluation: Technology is essential for competitiveness, but poor implementation can damage staff morale and performance. Success depends on training, planning, and secure systems.
Demographic & Employment Pattern Changes
Ageing population: Average population age rises due to low birth rates and longer life expectancy.
Changing patterns of employment: More part-time/flexible work, more women in workforce, higher skill expectations, tech replacing some labour.
Short evaluation: Demographic shifts create both market growth and staffing risk. Firms that redesign products and workforce strategy early usually gain an advantage.
Mind Map - Social, Tech & Demographics
CSR Tools
Technology Effects
Demographics
Employment Trends